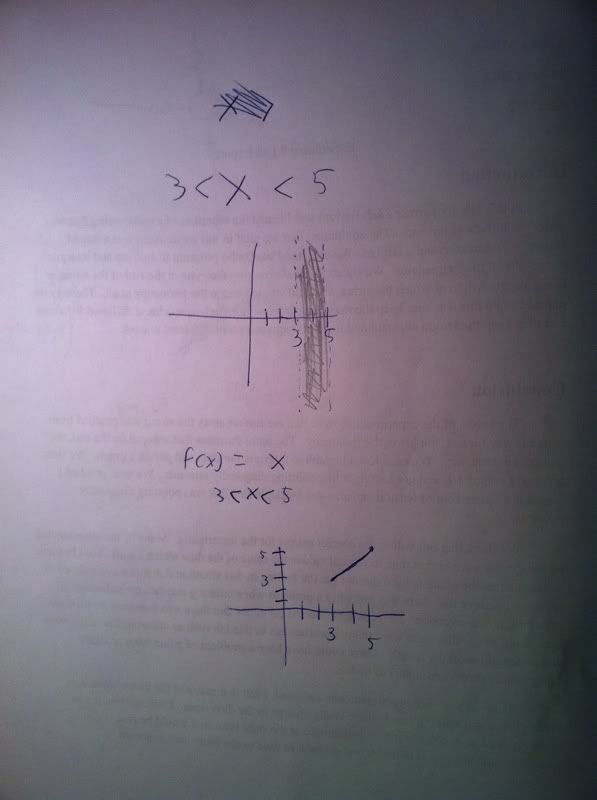
For the first graph there is an imaginary line at the vertical lines x=3 and x=5 and everywhere between is the region that is important because x is between 3 and 5.
For the second graph the function is y=x or f(x)=x (same thing) and since it says that x can only be between 3 and 5, I just graphed that line only on the range where x is on those values.
Now, to be correct, for the second graph I should have used open dots at x=3 and x=5 on the second graph. By having a dot on the end of each end of this line, it states that x does not touch these points. Remember x is greater than 3 but can't be equal to 3 for this case. Which is what an open dot means. If the problem had a greater-than-or-equal-to sign then a closed dot is ok. But it's important to note that we no longer have a 'line' because it doesn't continue forever so you don't want arrows at each end and instead you want a dot or in this case an open circle.